The quick and dirty:
Here’s an abridged cheat sheet of my favorite top commands to get you started using top quickly:
- W (capital w) saves your current configuration so top opens the same next time.
- f selects fields to display, o reorders them
- Z adjusts your colors
- x and y highlights your sort column and active/running processes, respectively.
- s changes the display frequency, in seconds
- [enter] refreshes the screen immediately (useful if the above is super long)
- k prompts to kill a task directly from top. Enter PID, follows by signal (SIGTERM is default)
- c toggles between name of the task and the full command
- u prompts for a user and will only show that user (leave blank to go back to all users)
- < and > moves the sort column to the right or to the left
- R reverses the sort order
- install and use htop for a better way to see how processes are organized, in glorious color!
The full explanation
While managing Linux boxes, top is a frequent command I use to understand a bit more of what’s going on, see if perhaps a process is eating up all the resources, and generally getting a feeling for how much use my machine is getting. However, I’ve only really focused on a few of the numbers, without knowing exactly what all the rest are. Let’s take a deep dive into top, and see exactly what it is.
The man page for top explains that top is used to “display Linux processes”, “system summary information”, and “a list of processes or threads currently beaing managed by the linux kernel.” You can get a pretty good understanding of what’s going on by spending some time looking at the processes automatically being updated, but what do all these numbers really mean? Let’s take a deep dive into top and all its features.
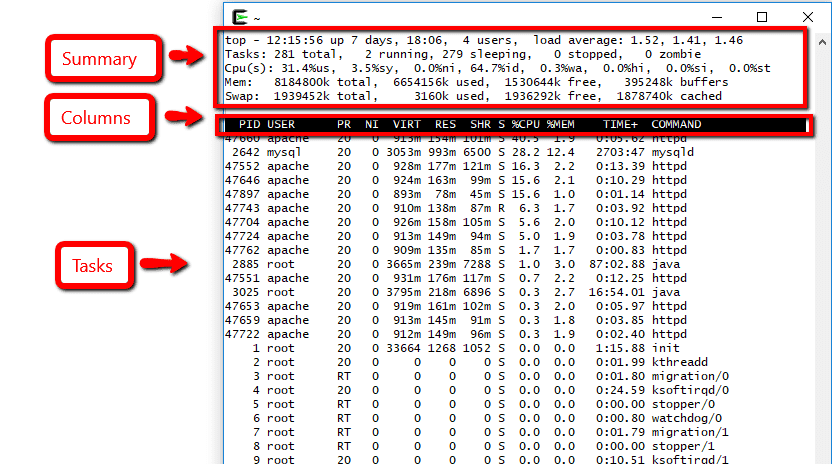
Top has three main sections.
- The Summary area
- The fields/ column headers, and
- The task area.
If you’d like to switch up your colors, type Z and follow the instructions to edit your color scheme. Once you are happy with your color scheme, from the main view of top (not where you change your colors) use W (capital w) to save the configuration.
A quick primer about memory
Good information to know is that there are three basic types of memory
- Physical memory, the actual RAM sticks inside your computer, which is a limited resource
- Swap file, a place on the disk (usually a partition) where memory can be saved if there are too many demands on the physical memory and
- Virtual memory, an unlimited (for our purposes) resource which abstracts away the physical memory, and serves so that each process is isolated from others
When a program uses memory, there are many different memory page types, including private, shared, anonymous, and file-backed. “file-backed” usually means that it loads an entire library, or a subset of a library, into memory for quick access (e.g. a c library function.) This can be shared or private. Anonymous is that pragmatically build by the program/process/task. This can also be shared or private.
Now – Lets look at three of our column headers concerning memory. Out of the box, these headers will be defaulted to show in top. We’ll get to the other columns later in this article!
%MEM – near the right, the %MEM column is RES divided by the total physical memory.
RES – anything occupying physical memory, both private and shared resourced. RES is short for “resident”, meaning anything that is NOT in the swap file. The number represented here is how much that process is currently using. This will pretty much always be less than the VIRT size. This number is a directly corresponds to %MEM
SHR – This is a subset of RES. It is shared memory used by the task, reflecting anything that can potentially be shared by another process. SHR indicates how much of the VIRT size is actually shareable.
VIRT – This is the total amount of virtual memory used by the task. This includes code, data, libraries, plus pages that have been swapped and pages that are mapped but not used. VIRT represents how much memory the program is able to access. It is the sum of memory used, memory mapped into itself, files on disk mapped into it, AND shared memory with with other processes. VIRT includes data that is over-committed
Some keyboard commands to try out
Once top is open, there are a number of keys you can press to toggle your display to show different things.
A : switches from the alternative display showing all 4 views (default, job, memory, user) and the full screen view
l, t, m, 1 : these change what the summary area displays. l shows or hides the load average line, t shows or hides the task/cpu states, m toggles the memory/swap lines, and 1 switches between showing each CPU vs the average of all CPUs
b : toggles the bold highlighting of the row/column (see below – bold rows indicate running tasks, bold columns indicate the sort order
c : shows the name of the task versus the command line used to run the task
G : Choose a different view / field group. Enter the number 1 through 4 to show which should be the current window.
H : toggles between showing threads or just processes
h : show the help for top
i : toggles between showing idle tasks along with the running ones, versus just running ones
k : kill a task. You’ll be prompted for a PID and then the signal to send. By default, the signal is SIGTERM. You can send any signal via number or name
r : renice a task, you will be prompted for a PID and then a value to nice it to.
R : reverse the column sort
x : toggles the row highlighting
y : toggles the running process highlighting
z : switch between colors and black/white
[enter] : refreshes the screen, useful if you are not automatically refreshing
s : change the refresh display frequency, in second. After pressing s, put in the number of seconds, e.g. 1.5 or 10
u : only show processes owned by a certain user (leave blank for all users)
The settings are great! How do I save?
You’ve played with the display, and you finally found something that you like and works for your environment. You press q to quit, but next time you run top, it’s back to the defaults! Fear not – to save, you need only type W (capital w) to save the settings to your configuration file.
Command line options to try
When starting top, you have some command line options that may help. While many of these can be achieved using the keyboard commands in the previous section, these are useful to try out too:
-M : show memory units of k/M/G in the summary instead of default
-m : show this many “frames” before exiting. A frame is refreshed at the delay time interval
-u : only show processes owned by a particular user/UID
The default columns
In our memory primer, we went over the 4 default columns related to memory There are a lot more to look into, so let’s dive right in! Below are the remaining default columns, at least in my RHEL 6 instance of top.
PID – the task’s unique process ID. This can wrap, but it never starts at 0. In Linux, an executable on disk is a program, and a program running and loaded into memory is a process. Each process is given a UNIQUE ID, and you can refer to that process (e.g. to kill it) using that PID. Both Daemons (system processes) and user processes (started automatically or manually) have their own PID. Each process has a parent process, tracing back to the init process that always has PID 1. (The kernel itself is PID 0).
USER – the effective username of the task’s owner. Effective is usually the same as RUSER (real user), but sometimes the user is changed to enable a non-privileged user to access files that can only be accessed by root. For example, when you call the ‘passwd’ command, this will update the /etc/passwd user account information, which is only accessible by root. Therefore, the “USER effective user” will be listed as root, while the “RUSER real user” will be listed as yourself
PR – the priority of the task. This is determined by the operating system. A lower number results in a higher priority. If you see “RT” in the priority column, it means the task is running in real time scheduling priority. PR is calculated by taking 20 and adding the nice value.
NI – similar to the priority, this is the nice value of the task. A negative nice value means higher priority, and a positive nice value means lower priority. Zero in this field simply means priority will not be adjusted in determining a task’s dispatchability.
S – Process status. This can be one of the following: D, which is uninterruptible sleep (waiting on system calls), R is running; S is sleeping; T is traced or stopped, and Z is zombie (completed execution but still in the processes table, needed because the function that called it still needs to read its exit status).
%CPU – By default, the column is the one being sorter on when you start top. This number represents the total CPU time the tak has used since the last screen update, expressed as a percentage of total CPU time. If you turn Irix mode off using I (capital i), each tasks CPU usage will be divided by the total number of CPUs. On a multi-core processor, with Irix mode on, the %CPU column total will often be more than 100%, as each core can be run up to 100%. With Irix mode off, the number will always be at or below 100%.
TIME+ – Total CPU time the task has used since it started. With cumulative mode on (with the S key), this will be both the process time and the time its dead children has used. This is more granular than TIME, including hundredths of a second.
COMMAND – this shows the command line or the program used. Toggle with lowercase c. When you’ve chosen to display command lines, processes without a command line (kernel threads) will be shown with only the program name in brackets, e.g. [khelper].
Adjusting Nice values
This is perhaps better suited for another post, but how do you change priority on a task? You do that using the Nice value. A lower Nice value is higher priority, the range is from -20 to 19.
- You can launch a program with your required priority using
nice -n nice_value program_name - you can also change the priority of an already running process using
renice -n nice_value -p process_id - You can re-nice a task directly from the top console by pressing r. It will prompt you for the PID and the value to nice it to.
Reordering Columns
From the main top display, press f or o to either select or reorder fields. You’ll be shown a screen with the fields and how to add or reorder them, using the equivalent 26 keyboard letters for 26 columns.
Sorting of tasks
To move the sort field left, use <
To move the sort field right, use >
x toggles the highlight of the sort field
Summary Area Fields
In the summary are are a number of CPU statistics that are abbreviated. These provide information about time spent in the following:
us: user mode – pretty much every program operation that is not a system call run in kernel space
sy: system mode – this is where the kernel (the operating system) runs its services. These are system calls only.
ni: low priority user mode (nice) – time spent on low priority processes
id: idle task – time spent idle
wa: I/O waiting – time waiting on disk i/o to be available. If this is high, you have a problem with disk throughput.
hi: servicing IRQs – handling hardware intterupts
si: servicing soft IRQs – handling software intterupts
st: steal (time given to other DomU instances) – when used by virtual machine, time stolen from this CPU.
The other columns
By pressing f, you can choose to display or hide all of the available columns. We went over the default 11 further up. Here are the remaining 15.
PPID : Parent Process ID. The process ID of a task’s parent. This is a parent-child (one to many) relationship, a single parent can span several child processes, but can only have one parent itself. It’s good to know the Parent ID in case things go wrong. For example, if a zombie process is hanging around for a long time, it could be an issue with the parent ID. Note that you can always “reap” (e.g. after it’s been killed, you remove it from the processes table) a zombie process by killing it’s parent ID.
pstree is a super useful program that shows the relationship of all processes, but fully exploring this is perhaps best for another post. (try pstree -pn to see the full tree with all PIDs!)
RUSER : Real user name. The real user name of the task’s owner. This defines which files this process has access to. When you use, for example, the passwd command, the USER will be root but the RUSER will be you.
UID : User ID. the effective user ID of the task’s owner. A UID is a number assigned by linux to each user on the system. UIDs are stored in /etc/passwd – the third field is the UID. UID 0 is always to root account. system UIDs (sometimes called pseudo-users) are usually 1-99. The UID 655347 is often reserved for nobody, a user with NO privileges, as opposed to an ordinary (non-privileged) user. The UID is an unsigned 32-bit integer, meaning just north of 4 billion possible values.
GROUP : Group Name. The effective group name of the task owner. Groups are similar to users, can be found in /etc/group. Every file is owned by a user AND a group. Users may be grouped together in a group to utilize privileged access granted by that group. Groups also have IDs, similar to users.
TTY : Controlling tty (terminal interface). The name of the controlling terminal, usually the device (e.g. a serial port, pty, etc) from which the process was started and which it uses for input and output. If the task is not associated with a terminal, ? will be displayed. tty is a native terminal device, either hardware or kernel emulated, and a pty (pseudo terminal device) is one which is emulated by another program, such as xterm, screen, or ssh. a pts is the slave part of a pty.
P : Last used CPU (SMP). SMP stands for Symmetric Multiprocessor System. This number represents the last used processor. In an SMP encironment, this will likely change frequently, as the kernel intentionally uses weak affinity.
SWAP : Swap size. Per-process swap values, taken from the /proc/#/status vmswap field. Paging excess memory to disk in swap keeps the OS from having to kill processes to free up real RAM. SWAP also counts pages that come from files mapped with mmap, and are only loaded to RAM when they are referred by the program. These pages will be paged out to the original file rather than to the swap devices if they ever need paging out.
TIME : CPU time. Total CPU time the task has used since it started. When Cumulative mode is ON (with S), each process is listed with the cpu time that it and its dead children has used.
CODE : code size. The amount of physical memory devoted to executable code, also known as the ‘text’ resident set’ size or TRS. This is how much the actual code you run is loaded into RAM.
DATA : Data+Stack size. The amount of physical memory devoted to other than executable code, also known as the data resident set, or DRS. After you allocated memory, the DATA increases. To understand the different between DATA, CODE, RES, and VIRT, take a look at the top answer on this stackoverflow question.
nFLT : Page Fault Count. The number of major page faults that have occurred for a task. A page fault occurs when a process attempts to read from or write to a virtual page that is not currently present in its address space. A major page fault is when disk access is involved in making that page available.
Check out page faults using ps -eo min_flt,maj_flt,cmd
To compare to a minor page fault: A minor page fault is when the page is in shared memory, and simply needs to be updated to the new process. Similarly, when allocating memory, the kernel allocates it only in virtual memory. As soon as the process needs to actually write to that page, it is allocated and assigned to the process. No disk access is involved in minor page faults.
A major page fault is when a swap-out (write page to disk) or swap-in (read page from disk) occurs. When an OS spends more time trying to satisfy major page faults than actually running a process, it’s called ‘thrashing.’
See this page for an AWESOME explanation of faults
nDRT : Dirty Pages count. The number of pages that have been modified since they were last written to disk. Dirty pages must be written to disk before the corresponding physical memory location can be used for some other virtual page.
wCHAN : Sleeping in Function. Depending on the availability of the kernel link map (System.map), this field will show the name or the address of the kernel function in which the task is currently sleeping. Running tasks will be displayed with a dash – in this column.
FLAGS : Task Flags. This column represents the task’s current scheduling flags which are expressed in hexadecimal notation and with zeros suppressed. These flags are officially documented in linux/sched.h. Less formal documentation can also be found on the ‘Fields select’ and ‘Order fields’ screens.