My Server is Slow. Why?
My Server is Slow.
This question is as ambiguous as it is ubiquitous. It is up there along with “My internet isn’t working”, which similarly can have so many different interpretations depending on who’s asking. Let’s take a deep dive into some advanced techniques to see exactly WHY “my server is slow”, and possible remedies for each topic of concern.
In this article, my troubleshooting will focus on headless Linux servers, since that’s mostly the type I interact with in my day-to-day activities. However, the basic principle behind this can be applied to other computer types, including Linux with GUIs, Windows machines, and Macs. The only difference will be in the tools used to diagnose.
Start with the CPU
We have to start somewhere, and I usually start with the CPU when investigating a slow computer. First thing to do is open up top and check out some numbers. If you are unsure how top is used or what all the columns mean, check out my primer “Understanding top, all those numbers, and how it can help you diagnose issues“.
In the screenshot on the right, you can see an output for “top”. If you have more than one CPU, you can separate out that one line into multiple, by pressing the “1” key while in top. However, because the Kernel is really efficient at using CPUs properly, I keep it as the combined / average view.
The important numbers to look at are the following:
us : user mode. This is percentage usage of the CPU in user time. Pretty much every single program operation that is not a system call is operating in user mode.
sy : system mode. This space is where the OS (the Kernel) runs its services. These are system calls only. For example, memory management, writing to disk. You can emulate a high system CPU usage by doing something that writes to disk constantly, e.g.
dd if=/dev/urandom of=/dev/null bs=1M count=1000
The above simply copies a stream of random data to /dev/null. Writing is a system call, and this task will be at 100% CPU, using all system time.
id : idle task. This is simply indicating the amount of time the CPU had nothing to do (it was sitting idle.) This should ideally be greater than 0 most of the time
wa : I/O waiting. This is a fairly important one to check out, because it indicates the percentage of time the CPU is waiting on disk i/o to be available. This is a problem because time waiting means nothing else can happen.
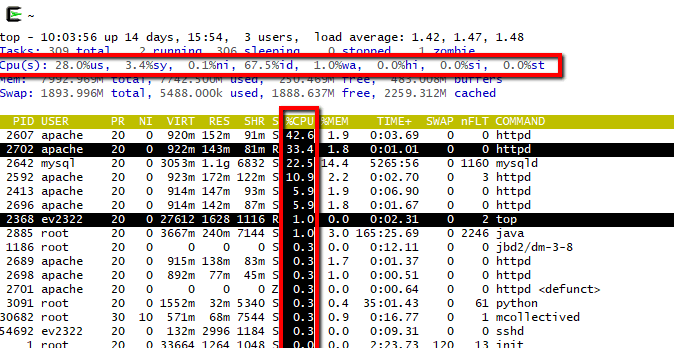
My output for top. Note in particular the CPU row at the top, and the CPU column in the main content.
CPU user/system HIGH, CPU wait LOW
If user and/or system CPU usage is high (therefore idle time is low), and waiting time is low, the next step is to look at what process is eating up the CPU time. For that, take a look at the columns on the lower half of top.
Note: If you don’t see the CPU column, press f to choose columns, then use < or > to toggle which column is sorted, and if needed press R to reverse. To highlight the search column, use x. For more info, read up on my top primer article.
Now that we’re looking at our processes sorted by CPU usage, take a look at which ones are using the most CPU. If these programs are “popular”, frequently installed/used programs, (such as Apache web server), and you’re running the latest patch of your version, you can be fairly certain that the program is optimized to its full potential. However, if the program is a custom script you wrote or have control over, (e.g. you have access to the source code,) it may behoove you to take a look and see if it can be optimized. You or the original author may have written it hastily and failed to see an optimization option that would improve the time complexity, e.g. an inefficient sorting algorithm or needlessly nested loops.
If the process’s CPU usage seems abnormal, you can always kill it and start it again – occasionally something simply goes wrong, and “turning it off and on again” is your answer. If it goes back to normal CPU usage, you’re good to go.
What if the high CPU usage seems normal, the process/program is optimized, yet CPU usage is still high? Well, in this case you may need to think about moving services to another server, or boosting the core count of the virtual machine you are using to spread the load.
CPU wait HIGH, swap HIGH
What if the CPU idle time is positive, user & system time are not maxed, but the wa i/o waiting percentage is consistently high? In this case, we have a disk in/out issue, which can often grind a server to a halt. The one that will cause the most issues is the high usage of swap space.
Take a look at this article for an awesome explanation of how swap space is used (and what a “major page fault” is). In brief, when physical memory is used up, the OS/Kernel, in an effort to keep all programs running, will copy pages of memory to disk. This frees up RAM space for programs to use immediately, but the downside is that disk read/write is considerably slower than RAM i/o operations. This operation is fine if it happens on occasion, but when your physical memory is full and programs keep requesting RAM pages that the kernel has to read in & out of swap repeatedly, this is called “thrashing” and can grind your computer to a halt, as the system is spending much more time swapping pages in & out of memory than it is in actually running the processes.
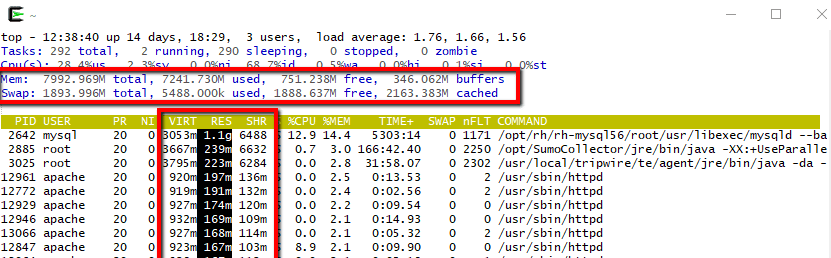
In top, you can toggle the memory display with m. Take a look at the two memory rows highlighted above. In this example, I have very low swap usage, and my CPU i/o wait is low, because I have plenty of RAM available in my machine. If these numbers on your machine indicate high Swap usage, you can take a look at the processes in the bottom part of top and organize by %MEM, RES, or another RAM indicator to see what program is using up the RAM. As in our CPU example, you have a few options. If you wrote a script and have access to the source code, perhaps you can optimize the space complexity to make it use less RAM. Or, maybe a common process is display some irregular behavior with unusually high RAM, and you can kill it and start it again to see if the situation improves.
If you can’t optimize and it’s not a fluke solved by killing, then you have a couple options. Easiest is to simply add more RAM to the machine, either with physical RAM modules in the server or by allocating more if this is a virtual machine. The other option is to move services to another machine entirely, to spread out the RAM usage between servers.
Another method to track i/o usage is using vmstat – a program that displays the virtual memory statistics of your system. This might be more useful than top, because it shows you a historical picture of the machine. If the columns for si and so are only occasionally high and otherwise close to zero, it’s much better than if the si and so swap columns are always high. In addition, take a look at the r and b procs columns. The first column r represents the number of processes waiting for runtime, while the b column represents processes in uninterruptible sleep. If the b column consistently has a high number of processes, (higher than column r), again you have swap space and RAM issues.
You can also take a look at the command “free”, which displays the amount of free and used memory in the system. Between all these tools, you should be able to get a pretty good understanding of which program is taking up lots of RAM, and what you can do about it.
CPU wait HIGH, swap LOW
If your CPU wait is high, but when looking at all your processes you cannot find any evidence that this is caused by swap i/o operations, then you have a disk i/o problem directly caused by your programs writing to disk. The easiest way to see what’s going on is with the program iotop. Use the left & right arrow keys to sort the columns, and you’ll quickly see which process is using up disk read & write. You have a few options now.
- If the disk usage seems anomalous, kill the program and start again
- If the disk usage seems low, ask yourself if your server is running platter drives, and if so, consider upgrading to solid state drives which can be an order of magnitude faster.
- If the disk usage is low and you think your drives can perform better, compare the actual iops and speed that you’re getting (iostat is a great command for this) with what you should be getting in terms of iops and speed with your drives, per the manufacturer and taking into account and RAID system you may have setup. If these don’t match up, your drives may be starting to fail, and your low i/o could be due to bad sectors or other disk health issues. Run a disk integrity check at your earliest convenience and avoid any data loss!
- Otherwise, your programs are operating fine and high disk usage it’s a situation you have to deal with. Consider moving services to a database-driven system, or separate out your processes to different physical or virtual machines.
It’s something else!
So you’ve checked your CPU. Idle times are consistently greater than zero, and you have low i/o wait CPU times. Your memory looks underused, you don’t have a crazy amount of swap concerns, and all other general diagnostics seem normal.
But… you’re still asking yourself the question “why is my server slow?”
Well, now we get into some nitty gritty troubleshooting that can be due to a large number of highly specific issues. It’s important to note that if your have available CPU, RAM, and diskspace, it’s not your server as a whole that’s slow, it’s the process you’re running on that server that’s slow. Here are some things to think about:
- Do you have configuration problems with your program? Perhaps there’s not enough child processes allowed to be created
- Are you interfacing with an external application like an SMTP server? Maybe that third party only allows so many connections per minute
- Is your program connecting to an API? That end server could be bogged down or limiting your rate
- How’s your network speed to the server? Maybe the network somewhere between you/the service is bogged down by a slow switch, cable, or simply congestion on the network
- Are your disks connected over the network, perhaps a NAS or other system? That end-device may be having issues1
These are just SOME examples of things you should be thinking about when diagnosing a slow program. A tool you can use that might gleam some hints is called strace. In it’s most basic form, use strace -p [the PID of a process]. This will intercept and record all system calls of a process and their exit code. A great deal can be learned about system calls of processes, even if you don’t have access to the source code. For example, following an Apache process, you can see the IP addresses of requesting clients, files being read, sockets being opened & written to, and more. strace is complex, but very useful if you have nowhere else to turn to.
Join the conversation!
Have anything to add?If you spot an error in my article, something that could be improved on, or have an additional question, please leave a comment below!
Header image by Wikimedia commons user Victorgrigas, used with CC Attribution-ShareAlike 3.0 Unported licensing.